Table of Contents
Step By Step Guide
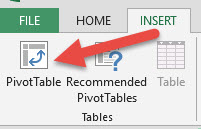
STEP 1: Click in your data and go to Insert > Pivot Table

STEP 2: This will bring up the Create Pivot Table dialogue box and it will automatically select your data`s range or table.
In the Choose where you want the PivotTable report to be placed, you can either choose a New Worksheet or an Existing Worksheet.
If you choose a New Worksheet it will place the Pivot Table in a brand new worksheet (e.g. Sheet2).
If you decide to put the Pivot Table in an Existing Worksheet, you will need to select the location by pressing the red arrow, choosing the cell where you want your Pivot Table to be placed, and then pressing the ENTER key twice to confirm.

STEP 3: You will now need to drag and drop the Fields in the different areas of your Pivot Table
- Region field in the Row Area
- Year field in Columns Area
- Sales field in Values Area

STEP 4:Now that your Pivot Table is set up, you need to Right Click in any of the Pivot Table values and choose Summarize Values By > Average

OR,
You can simply click on the arrow next to the Sum of Sales field mentioned in the Values Area and select Value Field Setting.

In the Value Field Setting dialog box, Select Average in the Summarize value by and Click OK.

STEP 5: Now you have your Pivot Table report showing the Average Sales values per Region for each year:

Format your Pivot Table Average number values
Many a time, when you are dealing with averages the result may end up with a different mixture of decimal places for different values.

It would be ideal to format the result for a better presentation. To do so:
STEP 1: Right Click on any value cell and select Value Field Setting.

STEP 2: In the Value Field Setting dialog box, select Number Format.

STEP 3: In the Format Cells dialog box, select Number under Category and type 2 for Decimal Places. Click OK.

STEP 4: Click OK.

All values in the Pivot Table will now have 2 decimal points. The numbers look more presentable and are easy to compare.

Visualizing Data with Pivot Charts
Integrating Pivot Charts to Display Averages
To incorporate an average line in your Pivot Chart, you can follow these steps:
- Add a column next to your source data, naming it “Average.”
- Enter the formula
=AVERAGE($C$2:$C$15)to calculate the average, drag down the fill handle to apply it to your data range. - Refresh your Pivot Chart by clicking the “Refresh” button on the Analyze tab.
- Add the Average field to the Values section of your PivotChart Fields, then select “Add to Values”.
- Right-click the new average field in the Values area, and choose “Change Series Chart Type.”
- In the combo chart options, adjust the Sum of Average field to display as a line chart.
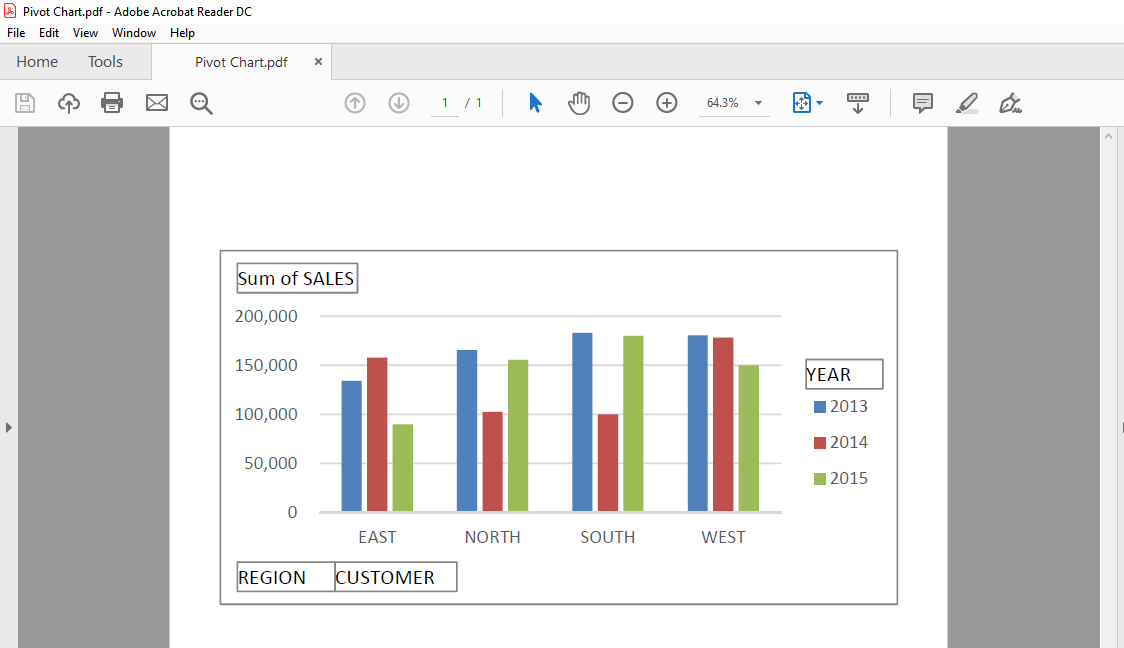
By now, your Average line should be visible on your Pivot Chart, providing a clear and immediate visual average across your data range. Here’s a sample of how a Pivot Chart looks like:
FAQs
How Do I Get Started with Pivot Tables in Excel?
To kick off your journey with Pivot Tables in Excel, dive in by gathering some data you’d like to analyze. Once you’ve got your data:
- Click any single cell inside the data set.
- On the ribbon, go to the Insert tab and click on the PivotTable icon.
- In the Create PivotTable dialog box, Excel will automatically select the data for your PivotTable. You can also specify a particular range if needed.
- Choose where to place your PivotTable – in a new worksheet or an existing one, then click OK.
Voila! You’ve created your first Pivot Table. Now, it’s time to explore by dragging and dropping fields to different parts of the PivotTable to start analyzing your data.
What Are the Best Practices for Showing Averages in a Pivot Table?
When it comes to displaying averages in a Pivot Table effectively:
- Ensure your data is prepared correctly—clean and free from duplicate rows or irrelevant columns.
- Add your data to the Values area of the Pivot Table and choose the ‘Average’ function instead of the default ‘Sum’.
- Double-check that the field you are averaging is not inadvertently counting blank or text values as zero, which would skew your average.
- Consider using a separate field for the count of data points if you need to reference how many entries contribute to the average.
It’s about maintaining data integrity and presenting your info in such a way that the ‘story’ behind the numbers becomes clear and actionable.
Conclusion
In addition to displaying averages, you can even show different calculation types such as count, maximum, minimum, product, and much more.
There are a lot more that you can do using Excel Pivot Table, Click here to know all about it!

John Michaloudis is a former accountant and finance analyst at General Electric, a Microsoft MVP since 2020, an Amazon #1 bestselling author of 4 Microsoft Excel books and teacher of Microsoft Excel & Office over at his flagship MyExcelOnline Academy Online Course.


