
Mastering standard error in Microsoft Excel is essential for anyone looking to dive deep into data analysis and descriptive statistics. The standard error in Excel serves as a critical tool, enabling analysts to understand the reliability of their sample means to the actual population mean.
This article not only illuminates the significance of standard error but also guides readers through organizing data, differentiating between types of standard errors, calculating standard errors using functions, and ensuring accuracy in their results
Key Takeaways
- The Standard Error‘s Role is to assess the trustworthiness of sample statistics and offer insights into how sample means might differ from the population mean.
- The initial step in calculating standard error involves meticulously organizing your dataset, ensuring it’s ready for accurate and efficient analysis.
- Excel provides built-in functions (STDEV.S and COUNT) for straightforward standard error calculations, alongside manual calculation methods for those seeking a deeper engagement with their data.
- Ensuring the accuracy of standard error calculations involves careful verification of formulas, data ranges, and the identification of outliers, along with proper formatting and consistency in using population vs. sample formulas.
Download the spreadsheet and follow along with the blog on How to Calculate Standard Error in Excel – Download excel workbookStandard-Error-in-Excel.xlsx
Table of Contents
Introduction to Mastering Standard Error
The Significance of Standard Error in Data Analysis
The standard error is the beacon that guides you through the sea of data. Imagine embarking on a journey to make informed decisions based on statistics. To navigate these waters safely, you need to know how much trust you can put into the average figures your data presents. This is where standard error shines, providing an estimate of how much sample means are expected to differ from the actual population mean.
Let’s say you’re a quality control manager assessing the accuracy of machine-produced components. Standard error assists you in determining if your machine’s performance is consistent or if there’s too much fluctuation, and consequently, whether the production process needs adjustments. It’s this kind of critical insight that highlights the importance of standard error in your analysis toolkit—it helps validate your findings and ensures that the decisions you make are backed by reliable data.
By using standard error, you’re not just crunching numbers; you’re analyzing with a purpose. You can confidently interpret your sample statistics, knowing they provide a window into the larger population’s behavior. This is why understanding and applying standard error effectively can significantly elevate your data analysis game.
Preparing Your Data for SEM Calculation
Step 1: Organize Your Dataset
Before you calculate the standard error, think of your dataset as pieces of a puzzle. To see the complete picture, you’ll first need to meticulously place these pieces correctly
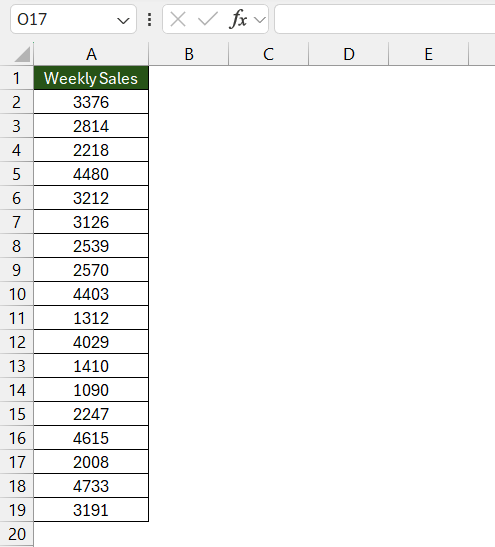
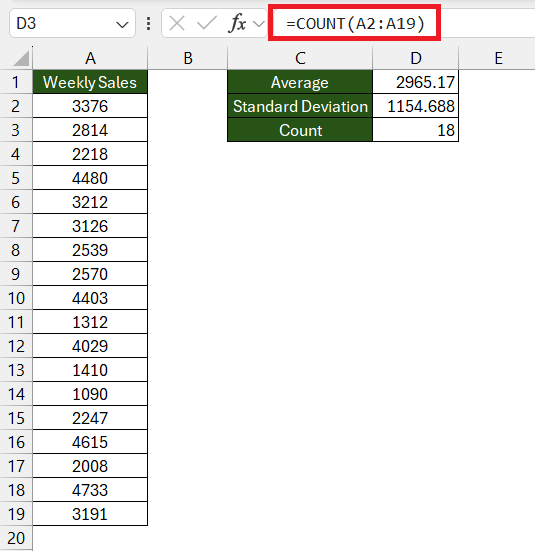
For instance, let’s consider you’re a market analyst and have weekly sales numbers. List them down successively in a single column, like so:
So, whether your data set is a small trickle or a vast ocean, tidiness is key. Prepare your rows and columns without haste; you’re paving the way for swift and accurate SEM calculations down the line.
Step 2: Understanding Different Types of Standard Errors
Before delving into calculations, it’s vital to understand that not all standard errors are created equal. While you might often deal with the standard error of the mean (SEM), other types cater to different data analysis contexts. For example, you might come across the standard error of the median, proportion, or range in various statistical endeavors.
When working with averages, SEM is the go-to, as it pertains to the accuracy of your sample’s mean. If your aim is to look at the middle value of your data, then the standard error of the median will be more appropriate. For binary data, such as yes/no responses, the standard error of the proportion will come in handy, providing insight into how much the sample proportion is likely to vary from the actual population proportion.
Grasping the type of standard error that suits your data is like choosing the right tool for a job—it’s essential for achieving accurate and meaningful results. So invest a little time in understanding this step, and your statistical analysis will be all the more potent for it.
Detailed Steps to Calculate Standard Error
Using In-built Functions for SEM
Excel might not have a single magic button for standard error, but it offers the next best thing — in-built functions that make the calculation a breeze. For SEM, you need two primary functions: STDEV.S and COUNT.
Start by employing STDEV.S which calculates the sample standard deviation—a measure of how spread out your numbers are from the mean of the sample. Then use COUNT to find the number of observations in your dataset. The square root of the count gives you the divisor needed to find the SEM when you divide it into the standard deviation calculation.
Here’s the formula you can use:
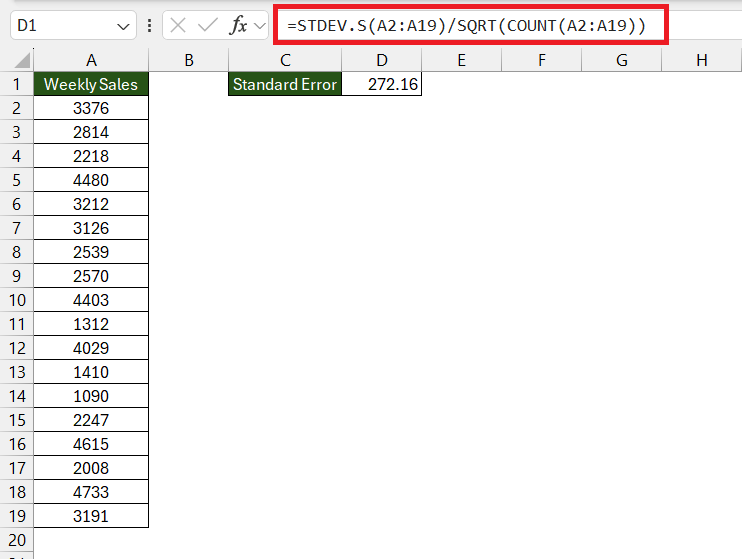
=STDEV.S(range)/SQRT(COUNT(range)).
Replace range with the actual range of your dataset. For example, if your data is in cells A2:A101, your formula will look like this: =STDEV.S(A2:A19)/SQRT(COUNT(A2:A19)).
Enter this formula in a cell outside your data range to get the standard error.
Using these functions is not just about getting to the result—it’s about doing it with confidence and precision. Why? Because they are designed to do the heavy lifting of calculations for you, ensuring that human error is minimized.
By familiarizing yourself with these straightforward Excel functions, you’re essentially adding powerful tools to your data analysis toolkit. They will save you time, increase accuracy, and provide a solid foundation for any statistical interpretation you aim to present.
Manual Calculation: A Step-by-Step Breakdown
For those who desire a deeper connection with their data, manual calculation of the standard error provides a hands-on approach. It’s a bit like making bread from scratch — a bit more effort, but thoroughly gratifying. Here’s how you can calculate standard error in Excel manually, step by step:
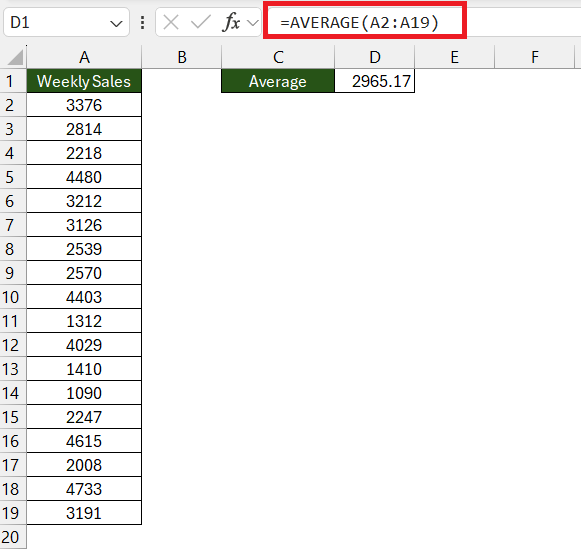
STEP 1: Calculate the Mean: Start with the average – use the AVERAGE function. Type =AVERAGE(A2:A19) into an empty cell to find the mean of your sample.
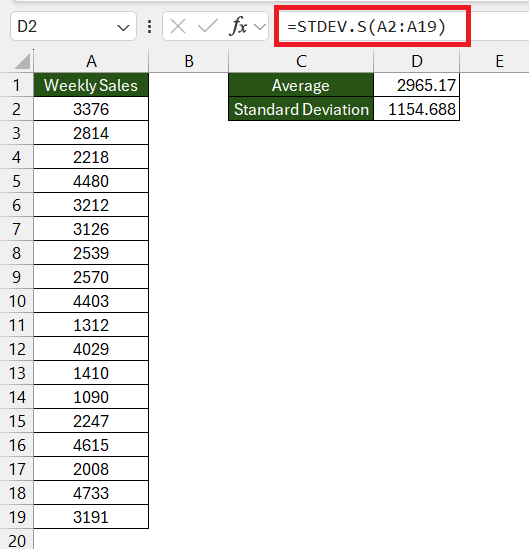
STEP 2: Find the Standard Deviation: Use the STDEV.S function for samples. For the same range, enter =STDEV.S(A2:A19) to calculate this.
STEP 3: Count the Data Points: Determine the size of your sample with the COUNT function, like so: =COUNT(A2:A19).
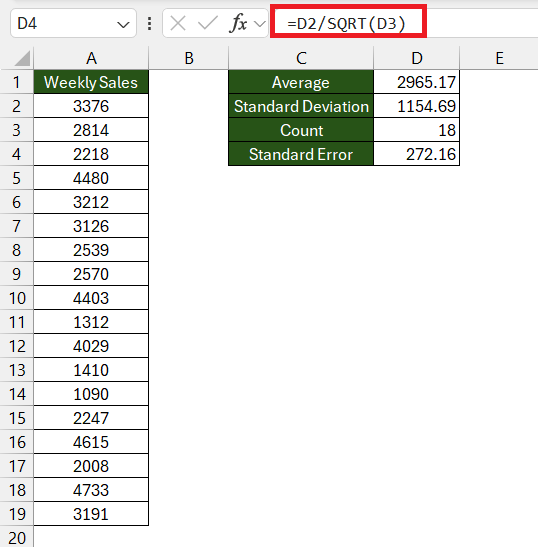
STEP 4: Compute the Standard Error: Now, it’s time to put it all together. Divide the standard deviation (STDEV.S) value by the square root (SQRT function) of the total count of your data points. If D2 holds your standard deviation and D3 holds your count, the SEM can be calculated with =D2/SQRT(D3).
By going through these individual steps, you nurture a deeper comprehension of the calculations Excel performs, giving you stronger control and insight into your data analysis process.
Moreover, it’s always beneficial to understand how things work behind the scenes. Manual calculations can not only provide a better understanding but also allow for greater scrutiny and flexibility, adjusting the formula as necessary based on your dataset’s peculiarities.
Roll up your sleeves, dive in, and let those raw numbers tell their story—manually calculating the standard error is a robust skill that underlines your proficiency in data analytics.
Practical Tips and Tricks for Swift SEM Calculation
Shortcuts and Formulas Simplified
Excel keyboard shortcuts are the secret sauce to speed up your data analysis workflow. Here’s a cheat sheet to some of the most impactful ones that relate to standard error:
- Quickly select an entire data range by clicking on the first cell and pressing
Ctrl + Shift + Down Arrow(orRight Arrowfor horizontal data). - After selecting your range,
Alt + =automatically sums the highlighted cells, a starting point for various other calculations. - To count the number of entries, select the range and use
Alt + E, S, Cto invoke the ‘Count’ command.
Incorporate these into your Excel routine, and watch your productivity soar as you breeze through datasets and calculations with ease.
Ensuring Accuracy in Your SEM Results
Accuracy is paramount when calculating the standard error in Excel. Think of it as navigating through a forest; the clearer the path, the less likely you’ll trip over a root. Here are the steps to ensure you arrive at the correct SEM without stumbling:
- Verify the Formula: Check the SEM formula for accuracy before hitting ‘Enter’. This precaution helps eliminate the chances of a simple typo throwing off your entire analysis.
- Double-Check Data Ranges: Is the cell range you’ve selected for the calculation correct? Ensure it encompasses all relevant data without including any irrelevant cells.
- Review Data for Outliers: Outliers can significantly affect your standard deviation and, in turn, your standard error. Make sure your data is clean and outlier analysis has been conducted.
- Ensure Proper Data Types: Numeric data should be formatted as numbers, not text. Formatting issues can cause erroneous results.
- Be Consistent with Population vs. Sample Formulas: Know whether your data represents a population (
STDEV.P) or a sample data set(STDEV.S). Incorrect use of these functions can lead to inaccurate standard errors. - Utilize Excel Functions for Help: If you’re unsure about which standard deviation function to use for your SEM, Excel’s function descriptions can be a helpful guide.
Remember, precision in your process equals precision in your results. Slow down, assess each step carefully and your SEM calculations will reflect the true variability of your data, leading to more trustworthy insights.
FAQs on Standard Error in Excel
Q1: What is the formula for standard error in Excel?
In Excel, the standard error of the mean can be calculated using the formula =STDEV.S(range)/SQRT(COUNT(range)). Make sure to replace range with the actual cells that contain your data. This formula employs Excel’s functions to find the sample standard deviation and divide it by the square root of the sample size to give you the standard error.
Q2: Can standard error be negative, and if not, why does it happen in Excel?
No, standard error cannot be negative. It represents the spread of the sampling distribution, which is a magnitude and inherently non-negative. If you encounter a negative standard error in Excel, it indicates a calculation or data entry error. Double-check your formulas and inputs to correct any mistakes.
Q3: What’s the difference between STDEV.P and STDEV.S when calculating SEM?
In Excel, STDEV.S calculates the standard deviation using a sample of the entire population and should be used when computing the standard error. In contrast, STDEV.P calculates the standard deviation for the entire population. When you’re estimating the standard error, you’re typically working with a sample, not the entire population, hence STDEV.S is the correct choice.
Q4: How can standard error of the mean be reduced?
To reduce the standard error of the mean, you can increase the sample size. Because the standard error is inversely proportional to the square root of the sample size, a larger sample will decrease the standard error, yielding a more precise estimate of the population mean. Additionally, ensuring the sample is representative of the population can also help minimize variability and, hence, the standard error.
Q5: How do I interpret the results of standard error?
Interpret the standard error results by the size of its value. A small standard error indicates that the sample mean is likely to be a close estimate of the population mean, suggesting your sample data is reliable. Conversely, a large standard error suggests there’s more variability and less confidence in the representativeness of the sample mean. Lower standard error values mean higher statistical precision of the sample mean.


John Michaloudis is a former accountant and finance analyst at General Electric, a Microsoft MVP since 2020, an Amazon #1 bestselling author of 4 Microsoft Excel books and teacher of Microsoft Excel & Office over at his flagship MyExcelOnline Academy Online Course.


